Photo from wikimedia.org
Post by Eli Shayer and Scott Powers
It is well known that a starter’s performance tails off as he pitches deeper into a game. This drop off in results is attributed to facing the same batters multiple times, pitcher fatigue, and inconsistencies in mechanics. In this work, we examine reliever performance to see if there is an analogous effect.
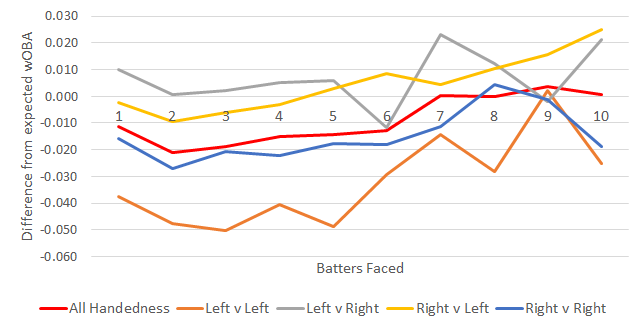
Our study uses wOBA. a statistic developed by Tom Tango that measures the contribution of plate appearance results toward run creation, in units of runs. When assessing a pitcher’s quality, a low wOBA indicates a high performance by the pitcher, while a high wOBA shows the opposite. Expected wOBA is derived from the season wOBA of the batter. The figure below shows the difference between observed and expected wOBA for relievers, as a function of the number of batters faced, based on all batters faced by MLB relievers from 2000 to 2013.
For example, the value 1 along the x-axis corresponds to the first batter faced by relievers. The value 2 along the x-axis corresponds to the second batter faced by relievers, and so on. Because pitcher and batter handedness have a significant impact on the result, we separate the results into separate curves for each possible handedness pairing. The “All Handedness” curve is the unweighted average of the four other curves.
After the fourth or fifth batter faced (BF), results fluctuate greatly due to insufficient sample size, but all curves show the same pattern at the beginning: On average, the wOBA of the first BF is 10 wOBA points higher, relative to expectation, than the wOBA of the second BF. This difference of 10 wOBA points scales to a difference of about 0.37 runs per 9 innings (because the average number of batters faced per 9 innings is about 37).
Our proposed explanation of this frictional substitution cost is that pitchers require some feeling out of their pitches and throwing at full effort before being completely game-ready. Warm up pitches in the bullpen appear to not sufficiently prepare a reliever for appearing in the game, and they pay the price when facing their first batter.
What kind of relievers struggle most against the first batter faced?
While we account for batter skill by comparing results against expected results for the batter (and in doing so adjust for year), the above results do not account for pitcher ability. Pitchers who face more batters than average are over-represented, relatively, against the fifth BF, while pitchers with fewer BFs than average are relatively over-represented against the first batter faced.
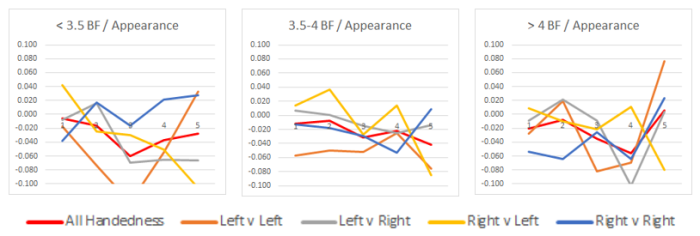
To account for this source of bias, we define a reliever’s type based on the number of batters he faces in an average outing. The three categories were < 3.5 BF, 3.5 – 4 BF, and > 4 BF. These categories were derived from the distribution of average number of batters faced, which was centered at 3.5 – 4 BF, with long tails on either end. Using the same model as above, we made a similar graph for each category of reliever, included in the figure below.
Dividing the data to this granularity, we observe that the sample sizes have been reduced sufficiently to mask the signal with the noise. In none of the three graphs above is there a clear trend. However, one important observation is that the three groups of relievers do not have significantly different performance over all among the first five batters faced. So we have assuaged concerns that the observed first batter effect may be due to sampling bias.
How do relievers struggle against the first batter faced?
To try to understand exactly how reliever performance changes as they face more batters, we broke down the distribution of results for each number of batters faced. In the table that follows, we have found the percentage of plate appearances that end in each result.
The data in the table demonstrate that the mechanism for relievers performing worse against their first batter faced is a high level of power. The first batter of a reliever’s appearance hits fewer singles than typical, but makes up for it by hitting an above average proportion of doubles, triples, and home runs. Additionally, the peril of leaving a reliever in too long is clear when comparing the first few batters faced to the last few batters faced in the chart. In fact, the first batter effect is overcome by a reliever tiredness effect by the 7th batter, at which point reliever performance increasingly worsen, and is worse than their performance against the first batter.
What about the first batter faced in subsequent innings?
The final aspect of our analysis was looking at whether there is a first batter effect for each inning similar to the one we found for each appearance. Knowing that the first batter effect exists for the first inning we separated out that effect from a potential first batter of the inning effect. Thus this analysis looked exclusively at plate appearances pitched by relievers coming out of the dugout after pitching the final out of the previous inning. Pooling together all innings besides the first into number of batters faced results in the figure below.
The graph doesn’t show any notable patterns in the first several batters faced. There doesn’t appear to be an analogous first batter effect, and moreover the data shows an opposite result. There is an oddly consistent result in the fifth and sixth batters faced, which is a source of intrigue. Otherwise, the data doesn’t show an effect on the first batter of an inning, other than the first batter of the appearance as a whole.
Conclusion
We have shown that relievers struggle against the first batter they face, relative to expectation. Data were insufficient to identify which types of relievers suffered from this effect most, but we were able to identify that the reason for the increase wOBA of the first batter faced is an increase in power numbers. That is, the proportion of doubles, triples, and home runs against the first BF is higher than would otherwise be expected when relievers enter a ballgame.
Intuitively, these results make sense. A reliever who has just entered the game could not be described as being “in rhythm.” These results suggest that there is an increased risk of such a reliever throwing a mistake pitch, resulting in extra bases. Perhaps, on average, the time spent warming up in the bullpen is insufficient for a reliever to be “game ready.”
The frictional cost we observed is the equivalent of a difference of about 0.37 runs in ERA. So while much has been made of the value of using relievers, this effect is something that managers need to take into account when they are managing their bullpens.
Something that we did not explore is whether relievers struggle more against the first batter face when they have more or less forewarning that they will enter the game. This preparedness may be difficult to measure, but a possible surrogate would be an indicator of whether the reliever entered mid-inning. We leave this to future work.
Eli Shayer is an undeclared freshman from Anchorage, Alaska. He misses having snow available for cross country skiing.
Scott Powers is a PhD student in statistics and an analytics consultant to the Oakland Athletics. He plays catcher for the club baseball team and setter for the club volleyball team.
Contact Eli at eshayer ‘at’ stanford.edu and Scott at sspowers ‘at’ stanford.edu


shits stupid
LikeLike
As i was reading your article I was thinking of other possible ways to explain why relief pitchers struggle against the first batter faced relative to the next few batters that they face. One potential factor I thought of is, how good of a hitter is the first batter faced, relative to the next few batters that the pitcher faces? I would hypothesis that the first batter a relief pitcher faces is one of the better hitters on the opposing team a disproportionate amount of the time, compared to an average or below average hitter. This is due to the fact that managers are often hesitant to leave the current pitcher out to face a really good hitter, so as a result they might opt to have him face a fresh arm out of the bullpen.
LikeLike