
Nicholas Canova
“Are there any stats looking at the difference between NL and AL pitchers throwing at hitters? Without knowing intentions makes this stat a bit objectionable, but I would think having the pitchers bat would be a pretty good natural deterrent.” These are the types of sports questions I enjoy getting from friends – the question is interesting, and hopefully simple enough for somebody studying statistics in grad school to answer. So we ask, do National League and American League pitchers hit batters at the same rate or at different rates?
Rewording as a statistics question, we instead ask whether the National League’s HBP / 9 innings ratio and the American League’s HBP / 9 innings ratio differ at a statistically significant level. To answer the question accurately, we will compute for both leagues their HBP / 9 innings ratios, and then construct a hypothesis test to check whether the ratios are the same or different for the leagues. As with all hypothesis tests, we first declare a null and alternative hypothesis. The null hypothesis will be that the two leagues have the same HBP / 9 innings ratios (null hypotheses generally assumes that the two ratios are the same), whereas the alternative hypothesis will simply be that the two leagues have different ratios. Stating the alternative hypothesis that the two leagues have different ratios is considered a 2-sided alternative hypothesis, as opposed to a 1-sided alternative hypothesis that one league specifically has a higher ratio than the other league. We could have used the 1-sided alternative hypothesis that AL pitchers have a higher HBP / 9 innings ratio than NL pitchers, consistent with the natural deterrent argument, but instead chose to simply test whether the ratios are different using the 2-sided test.

First, let us look at the data, pulled from baseball-reference for the 2016 MLB season through July 27th.

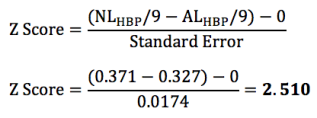
American League pitchers have hit 0.327 batters per 9 innings, compared with National League pitchers having hit 0.371 batters per 9 innings. Across the entire MLB, pitchers have hit 0.349 batters per 9 innings. Already this is counter-intuitive to the “natural deterrent” argument, since National League pitchers are the pitchers that must bat and also the pitchers that are hitting more batters. So much for that… continuing though with the analysis, to test whether these ratios differ at a statistically significant level, I introduce a few simple statistics formulas shown below. We first calculate the standard error of the MLB HBP / 9 innings ratio. As a statistics-101 reminder, the standard error is a measure of the statistical accuracy of an estimate (our estimate of the true MLB HBP / 9 innings ratio).

We next calculate the Z score for the hypothesis test, which indicates how many standard errors an element (the difference between the two HPB rates) is from the mean (assumed to be zero by the null hypothesis). You might remember from your high school statistics class that a Z score of 1.96 corresponds with statistical significance at a 5% level. In this case, our Z score is a bit higher.
Finally, we calculate a P value corresponding with the Z score calculated, which is the probability of finding the observed element (the observed difference in HBP rates) when the null hypothesis is true. A P value below 0.05 is often used as level to determine if a result is statistically significant, although really any P value can be used. And we actually do not ‘calculate’ a P value in this case, but rather use a table to look up the P value corresponding with the Z score calculated above – in this case, for a two-sided hypothesis test with a Z score of 2.510, the P value is equal to 0.012.
The conclusion? It is statistically significant at a 95% confidence threshold that the HBP / 9 innings rates are different between the American League and the National League, but not statistically significant at a 99% confidence threshold, however it is the National League that hits more batters, which counters the natural deterrent argument. Further, specifically why the rates are different is more difficult to conclude on, and is not particularly covered in the analysis. Are National League pitchers more erratic? Or are National League batters worse at avoiding getting hit by pitches? A look at interleague play could provide answers to one or both of these questions. We also could have looked at the analysis from a HBP / pitches perspective, rather than HBP / 9 innings. Either way, these analyses are for next time.

I wonder, is there a statistically significant change in HBP when pitchers are traded from one league to another?
LikeLike