
Nicholas Canova
Noah Syndergaard has tied the Met’s single season record for home runs hit by a pitcher, after launching this third home run of the season yesterday, a complete bomb off a full count pitch from Braden Shipley. This concludes this this article’s focus of Syndergaard’s hitting. Moving on…
This time last year, MLB.com posted an article discussing how the Met’s pitching staff was the hardest-throwing staff in baseball, and the numbers weren’t even close between the Mets and the next hardest-throwing team. See at the bottom for a link to that article. Looking at the percentage of a team’s pitches thrown over 95 mph, the article and its analysis found that roughly 21.1% of the Met’s team pitches clocked in over 95 mph, with the Indians coming in second with 13.5% of their team’s pitches over 95 mph. I’ve wanted to do a follow up to this article for much of this season, both comparing teams against each other by the performances of their pitching staffs as a whole, as well as taking a closer look at the Met’s pitching staff. As a Mets fan, it’s clear that their pitching staff as a whole (and especially the starting rotation) has not been as dominant as it was last year, at least when measured by how hard the pitchers are throwing, and I expect to find that their over-powering velocity numbers are not as dominant this year as they were last year.
The analyses for this article involved using MLB Advanced Media’s (MLBAM) PITCHf/x data, the fairly popular and very cool baseball dataset that measures pitch speeds, location, ball rotation and other factors for every pitch thrown in the MLB. After scraping this data from MLBAM’s website from opening day through August 16th, I first recreated the bar plot highlighting the percentage of each teams’ pitches thrown over 95 mph. 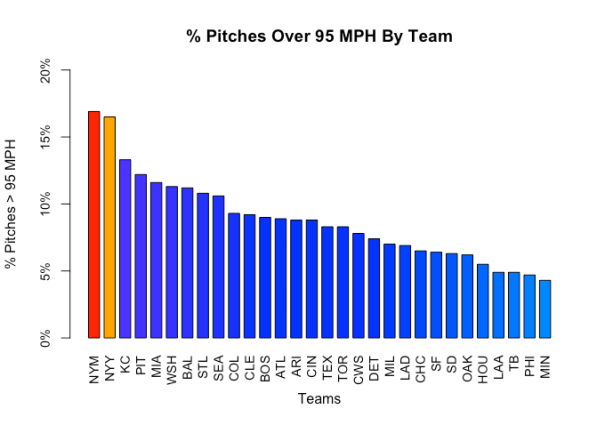 Taking the top spot thus far in the season is again the Mets, with 16.9% of their team’s pitches over 95 mph, although the Yankees are a close 2nd at 16.5%, with a drop-off to the Royals at 3rd at 13.3%. While the Mets are still the hardest throwing team, it is not surprising to see them take a step back, dropping almost 4.2% in percentage of pitches thrown over 95 mph from last year, given some of the struggles the team’s pitching staff has faced this season. Matt Harvey is the team’s second hardest throwing starting pitcher, and is out for the remainder of the season with thoracic outlet syndrome, Steven Matz and Noah Syndergaard have struggled with bone spurs in their pitching elbows, Jacob deGrom began the season slowly after pitching heavily in the playoffs last season, and Zach Wheeler has yet to throw a pitch in the majors this season. Despite all of these concerns, the Mets still take the top spot
So the Mets are still one of the hardest one or two throwing teams in baseball, even if not by as large of a margin as last season. However, last year’s article purported that we have a pitching staff loaded with several hard-throwing pitchers, who collectively combined to make the Mets the hardest throwing team in baseball. Which begs the question, is this year’s Mets team balanced with several rocket arms, or is the pitching staff being carried by only one or two of the leagues hardest-throwing guys?

The table above makes clear that Noah Syndergaard brings the heat most often, by a lot, while Jeurys Familia brings the heat with the highest percentage of his pitches. Note that Familia probably throws a much higher percentage of his fastballs over 95 mph, whereas the percentage column in the table above is the percentage of all pitches over 95 mph. Combined, Syndergaard and Familia have thrown 1,859 pitches over 95 mph, accounting for 64% of all such pitches for the Mets this season. Hansel Robles is third on the team, Harvey is fourth, and although deGrom, Matz and Jim Henderson have each thrown their share of heaters, Familia and especially Syndergaard are clearly carrying the team. Bartolo Colon has yet to toss a single pitch over 95 mph this season, although I expect this to change as he prepares to crank it up into late August and September.
Curious to compare, how well do Familia and Syndergaard stack up against the rest of the MLB? Specifically, how does Syndergaard stack up when looking at which pitchers threw the most pitches over 95 mph (a stat probably dominated by starting pitchers), and how does Familia stack up when looking at which pitchers threw the highest percentage of their pitches over 95 mph (a stat probably dominated by relievers)?


For relievers, Zachary Britton and Aroldis Chapman bring the heat the most frequently, with more than 80% of their pitches coming in over 95 mph. Chapman and Mauricio Cabrera are the only two pitchers whose fastballs average over 100 mph, which is absurd for an average fastball velocity once you think about it. Familia’s 63.5% of pitches clocking over 95 mph is good enough to be the 10th highest pitcher by this metric. On the other end looking at total pitches over 95 mph, Syndergaard tops the list. He’s thrown almost 350 more pitches over 95 mph than any other pitcher in baseball, and his average fastball velocity of 98 mph is more than 1.5 mph higher than the next hardest-throwing starting pitcher in baseball. I have no idea what the record for most pitches over 95 mph in a single season is, but I imagine Syndergaard could come close to it.
The Mets may not repeat as National League champions this season, but at least we’ve still got the hardest throwing staff in baseball going for us, which is nice.
I believe http://m.mlb.com/news/article/137868572/mets-pitchers-leading-mlb-in-top-velocity/ is the original article that was referenced earlier in the first paragraph of the post.
