Do Certain NCAA Basketball Systems Generate NBA Stars More Often? (1 of 3)

Nicholas Canova

In April 2016, the University of North Carolina hosted its annual Sports Analytics Summit, featuring a series of excellent guest speakers, from Dean Oliver to Ken Pomeroy, as well as a case competition that challenged teams to analyze the effects of NCAA basketball systems on generating star NBA players. More specifically, the case challenged participants to answer the question “Are there certain types of systems (offensive and/or defensive) that work to best identify future NBA superstars?” Our team of four entered the competition, focusing on the impact of offensive systems specifically, and we present here our core analyses answering the question and thoughts throughout the process.

Given the open-endedness of the challenge, we asked ourselves several initial questions including (1) what constitutes an NBA superstar and bust player, (2) how could we categorize NCAA basketball teams into different systems, and (3) what analyses / metrics could we look at that may indicate an NCAA player is more likely to become an NBA superstar or bust than is already expected for that player. We will address the majority of our work in detail over 3 short posts, highlighting some of the key assumptions in this first post. Looking at each of these 3 questions in detail should give a fairly thorough review of our overall analysis.

First, what constitutes an NBA superstar? We considered several metrics for classifying superstars, including a player’s number of all-star appearances, his box score stats both for impressiveness and consistency, performance in the NBA playoffs, etc., however we ultimately selected a player’s total win shares (WS) over the first 4 years of his career as the sole metric to classify a star player, which brings up a key factor of our analysis. Since an underlying focus of the analysis is helping teams identify NBA superstars (the case competition was hosted and judged by the Charlotte Hornets), we looked only at player performance over the first 4 years of their career after being drafted, which is the time period during which they are contractually tied to a team before reaching free agency. Mentions of total WS throughout the post should be read as a player’s total WS over his first 4 years after being drafted. Since a player’s likelihood of becoming a superstar is of course closely tied to his first 4 years of performance, we did not see this focus as limiting. As for the cutoff, we selected 20 WS over a player’s first 4 years. WS assesses a player’s overall NBA value in terms of the share of their teams’ wins each player is accountable for, and serves well in determining superstar players.

Stars         Busts

Second, what constitutes an NBA bust? We considered this question more challenging to quantify than the question on superstars, believing we could not look at WS alone on an absolute basis. Think about it this way – is a 60th overall pick with 0 WS a greater or lesser bust than a 1st overall pick with 5 WS? (5 WS over 4 years is very low for a top 10 pick – Greg Oden, highly considered one of the NBA’s premier bust players, even had 6.8 WS, whereas a star player such as Kevin Durant had 38.3 over this period). As expected, we consider that 1st overall pick to be the bigger bust than the 60th pick, due to the higher expectations put on top draft picks. More specifically, we considered any player drafted in the top 20 overall, with fewer than 8 total WS, whose WS were more than 6 fewer than what would have been expected given their draft position as a bust player. Both cutoffs for NBA superstar and bust seem arbitrary, but were selected them such that 5% – 10% of all players drafted were classified as stars and busts, respectively. The tables above highlight several of the star and bust players taken in the drafts between 2006 – 2012, and the players included in each table seems reasonable and passes a reasonableness test. Since this analysis requires 4 years of NBA WS data, we did not look at players drafted more recently than 2012, and lacked certain data earlier than 2006.

The last item we’d like to highlight in this post is clarifying what is meant by “WS were more than 6 fewer than what would have been expected given their draft position”. We will refer to total WS in excess of expected WS as net WS, and it is calculated based on the difference between actual WS and the expected number of WS given a player’s draft position. The graph below shows historically the average number of win shares in a player’s first 4 seasons at each draft position, with a line of best fit. We can use the graph’s line of best fit to estimate how many WS we expect a player to have then, given their draft position. For a player to over-perform their draft position, he would need to earn more WS than what the best fit line estimates. Going back to our earlier example, 1st overall pick Greg Oden would be expected to earn (-5.789 * ln(1) + 24.2) = 24.2 WS win shares, however only earned 6.8 WS, for a net WS of -17.4 As for Kevin Durant, his actual WS of 38.3 vs. expected WS given draft position of 20.2 resulted in a net WS of 18.1.

WS vs Draft Pick

With this basic foundation laid down, in the next post we will begin to look at our main clustering analysis of NCAA systems based on play-types, and extend this clustering analysis to the college systems of those players we’ve classified as stars and busts using the criterion above.


The Importance of Having a High NBA Draft Pick

Photo from pixgood.com

Post by Konstantinos Balafas

On October 21st, the NBA board of governors voted against reforming the NBA’s draft lottery. A very good review of the proposed changes and potential ramifications can be found here but the overarching theme of the league’s proposal was limiting “tanking”. The board of governors ended up rejecting the proposal and, while the argument that was made was that the changes would hurt small-market teams, it indicates that there are NBA GMs and owners that are (or may be in the future) willing to embrace a losing ideology for the reward of a high draft pick. That brings us to the “million-dollar” question: Is tanking really worth it?

THE DATA

In an attempt to answer that question with numbers, names and simple analysis, we gathered data for the “most successful” players since 2000 (from Wikipedia) and of the teams’ Win/Loss percentages since 1985 (from basketball-reference.com) – the year the lottery system came into effect. For the purposes of this article, the “most successful” players are those elected to All-NBA and All-Star teams, as well as the starters for teams that played in NBA Finals.

There are certain caveats to this analysis. As far as the players are concerned, traded picks, on draft night or otherwise, are not considered. So, for this analysis, Kobe Bryant is a Charlotte Hornets pick despite never playing a minute for them and Jeff Green, as the #5 pick in 2008, is not considered for helping Boston have the best single-year turnaround in league history. As far as the team performances are concerned, only the top pick of each team is considered in order to simplify the analysis. That means that any effect that Tristan Thompson (#4 pick, 2011) may have had for the Cleveland Cavaliers has been attributed to Kyrie Irving (#1 pick, 2011).

PICK DISTRIBUTIONS

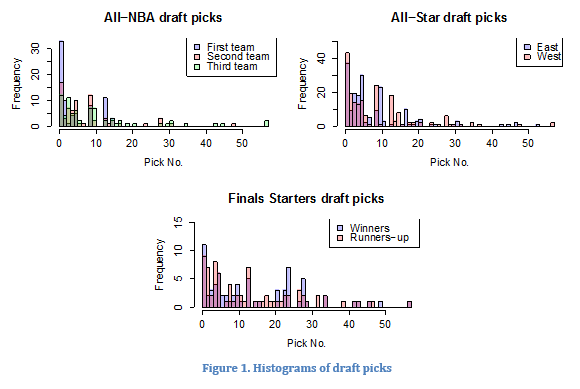
As a first-pass analysis, we plotted the histograms of the draft picks for the aforementioned player categories, which are shown below. The histograms show a concentration of draft picks in the 1-10 range, which reinforces the intuitive belief that “good players are generally drafted high”.

Balafas1

It is worth noting that no player drafted lower than 10 has made the first All-NBA team since 2000. So far, the pick distributions shown indicate that it is indeed important for a team to have high draft picks and therefore tanking may indeed be a viable strategy for lottery teams. However, a (very) good player does not a good team make, or Kevin Love would still be plying his trade in Minnesota.

For that reason, let us explore the picks of the players that have started at least one game in the NBA Finals over the past 14 years. Figure 2 shows these picks for the NBA Champions (left) and the NBA Runners-up (right).

Balafas2

Again, the vast majority of the players are drafted in the lottery (picks 1-14). Interestingly enough, with the exception of the 2007-2011 interval and the ’04 Pistons there has been no NBA Champion without a #1 pick. Even in the listed exceptions, these teams had multiple Top-10 picks. Still more indication that teams need lottery picks to contend for a title!

THE BIG-3 EFFECT

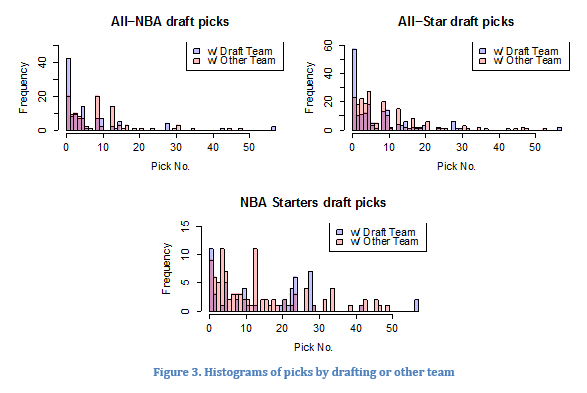
There is, however, an important parameter that has not been yet investigated. As the Miami Heat proved, the draft is not the only way to high draft picks and, subsequently, title rings. For that reason, Figure 3 shows the same histograms as Figure 1, only in this case different colors correspond to players that achieved the honors with the team that drafted them or a different one.

Balafas3

It generally seems that there is no clear trend in the distributions of draft picks with the drafting or with a different team. Top picks tend to stay (or be more successful) with the team that drafted them, while starting five in the NBA Finals tend to be assembled in ways other than the draft.

DRAFT POSITION VS. IMPROVEMENT

So far, then, even if there is no clear answer on whether a team is justified in tanking, quite a bit of the data seem to point that way. On the other hand we’ve looked at All-NBA teams, All-Star teams and NBA finalists. That can be a tall order for a young kid that has just been drafted (unless your name is Tim Duncan, but more on that later). It is reasonable then to investigate the more short-term effect of draft picks.

Balafas4

Generally, if a high draft pick were to be strongly correlated with success, we’d expect teams with a high draft pick to exhibit a significant improvement over the next year and the points in the top part (teams with a high draft pick) of Figure 4 would be clustered towards the right of the figure (large difference in W/L percentage), which is clearly not the case.

Maybe then, one year is too short of a time for a rookie to prove his worth? To control for that, we looked at the progression of win/loss percentage over four years after a high draft pick. The four-year window was selected since that is also the length of a rookie contract. Figure 5 shows the league average of the difference in win/loss percentage against the number of years since the team had a particular lottery pick in the draft.

Balafas5

Based on the previous figure, it can be argued that a team will consistently improve over the four years after a lottery pick. Of course, there are many other factors that play a part, such as other roster moves, coaching changes, new draft picks etc., as well as the fact that this is the league average. Still, it is hard to make a strong case against tanking.

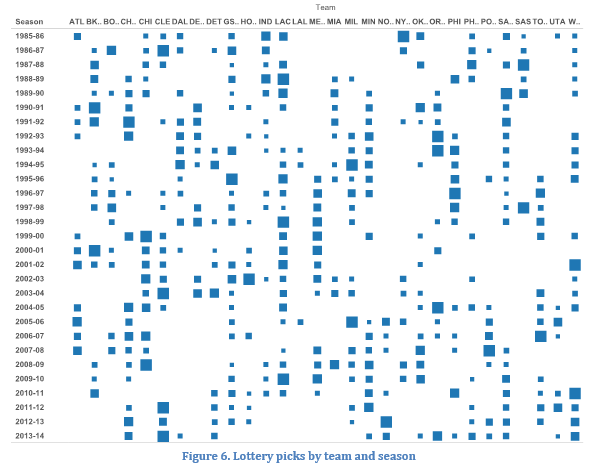
Does that, then, mean that a couple of draft picks can turn a franchise around? Figure 6 shows a grid of teams and seasons. A blue square indicates that a particular team had a lottery pick at a particular year and a larger square corresponds to a higher pick.

Balafas6

It can be seen that lottery picks come in waves. It takes more than a few years for a team to accumulate enough talent (or assets) to go from lottery team to playoff contender. Once the team goes through that breakthrough, though, there’s a good chance it will stay that way for at least a few years.

FROM DRAFT PICKS TO GLORY, OR, THE TIM DUNCAN EFFECT

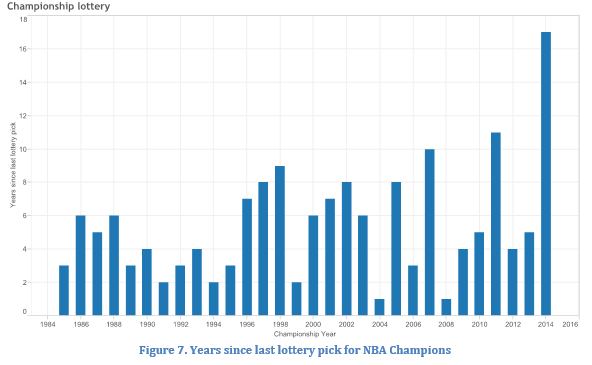
So, we saw that once a team has stockpiled enough high draft picks, it can break through the cycle of mediocrity and the Durant-Westbrook-led Thunder are living proof of that. Can that, though, lead a team to glory? The following figure shows the number of years since the last lottery pick for the NBA Champions since 1985 and, by the looks of it, it usually takes 4-6 years since the last lottery pick to win a championship. So, not an immediate turnaround, but well within the realm of possibility that the team won the Larry O’Brien trophy thanks to its lottery picks.

Balafas7

That is especially true for the case of one Timothy Theodore Duncan, who, as the last lottery pick of the San Antonio Spurs, has led them into a state of perpetual championship contention, 5 rings and 0 lottery picks in the past 16 years. While the contribution of Duncan is undeniable, there’s also a lot to be said about the system that he was drafted in. From the existence of a Hall of Famer like David Robinson and a Hall of Fame caliber coach in Gregg Popovich to the scouting team that brought All-Stars like Tony Parker and Manu Ginobili with the 28th and 57th pick respectively.

It is also worth noting that in the two cases of quickest lottery-to-championship turnaround (one year between lottery and championship), the 2004 Pistons and the 2008 Celtics, neither draft pick contributed significantly to the team. Darko Milicic, the #2 pick in 2003 averaged 4.8 minutes in 32 games for the Pistons (1.8 minutes per game in 8 games in the playoffs), while Jeff Green, the #5 pick in 2007 was traded to the Seattle Supersonics. It could, however, be argued that Jeff Green did actually contribute to the Celtics’ championship season as he was part of the package that took Ray Allen to Boston.

CONCLUSIONS

The first, and easiest, conclusion to be made here is that high draft picks tend to be good players. Secondly, it can be seen that players of that caliber are absolutely necessary for a team to challenge for a championship. Not only that, but, on average, a lottery pick will result in an improvement in win/loss percentage. Maybe not necessarily right away but at least within the lifespan of the rookie deal of said lottery pick. On the other hand, it is also demonstrated that it takes multiple high draft picks for a team to become a playoff contender, and that’s what it all boils down to. If a team is willing to suffer several years of mediocrity (to put it mildly) and accumulate a significant amount of talent through the draft, chances are that they will become a playoff (or even championship) contender. Like everything else, tanking takes commitment, but also has its rewards.

Konstantinos Balafas is finishing up his PhD on detecting damage from earthquakes. He grew up watching soccer and basketball and loves Steve Nash, Paolo Maldini and Bill Self.

Contact Konstantinos at balafas ‘at’ stanford.edu